INP-WealthPk
Qudsia Bano
Bank Alfalah Limited's quarterly accounts show mixed financial performance as its shareholders' equity increased from Rs100,015 million in December 2022 to Rs104,139 million in March 2023. This indicates growth in the net assets available to shareholders during the period.
The bank's total assets increased from Rs2,253,197 million in December 2022 to Rs2,532,315 million in March 2023. This suggests an expansion in the bank's overall asset base. Bank deposits also increased from Rs1,486,845 million in December 2022 to Rs1,554,035 million in March 2023. This signifies a rise in customer deposits, indicating increased inflows of funds into the bank.
Net advances, however, decreased from Rs732,375 million in December 2022 to Rs697,993 million in March 2023. This is an indication of a decline in lending activities during the period. Net investments increased from Rs1,114,407 million in December 2022 to Rs1,283,986 million in March 2023. This suggests an increase in the bank's holdings of investment securities. These financial position changes highlight the bank's overall stability and potential for future growth.


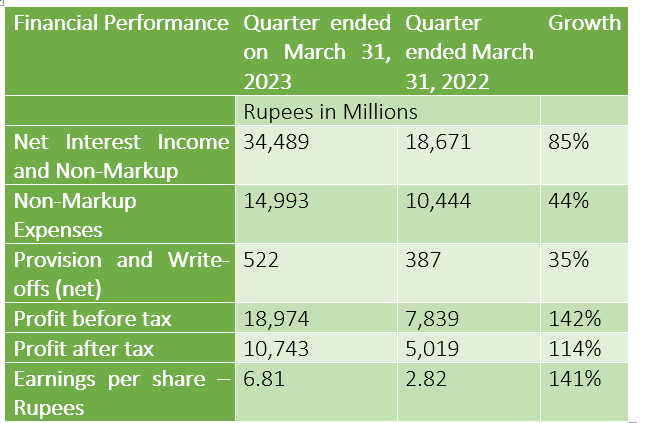
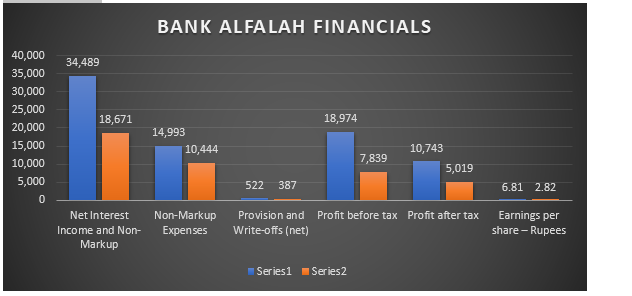
Bank Alfalah's financial performance for the quarter ended on March 31, 2023, reveals significant growth and improved profitability compared to the same quarter of 2022. The net interest income and non-markup income increased to Rs34,489 million, representing an impressive growth rate of 85%. A key contribution was markup income, which grew significantly by 95.5% and stood at Rs27,937 million. The increase in markup income is driven by a combination of net earning assets growth and re-pricing of the asset book. This indicates a substantial increase in the bank's interest income and non-markup revenue sources.

Fee and commission income exhibited strong growth, with a notable increase of 33.6% year-on-year (YoY). This growth can be attributed to branch banking fees, which experienced a surge due to increased business activity and a larger customer base, despite offering certain services free of charge to the account holders. Additionally, combined debit and credit card expenditures witnessed a significant rise of 55%, with substantial spending in categories such as travel, fuel, grocery, and dining. These trends indicate a positive revenue stream generated through fee-based services and highlight the bank's ability to capitalise on customer spending patterns and market opportunities.
Non-markup expenses rose to Rs14,993 million, reflecting a growth rate of 44%, suggesting higher operating costs. The provision and write-offs, after net adjustments, amounted to Rs522 million, indicating a growth rate of 35%, highlighting a conservative approach to managing credit risks. Profit-before-tax surged to Rs18,974 million, showcasing remarkable growth of 142%, indicating improved operational efficiency and revenue generation. Profit-after-tax leapt to Rs10,743 million, reflecting a growth rate of 114%, demonstrating effective management of expenses, provisions and revenue generation.
The earnings per share stood at Rs6.81, exhibiting a growth rate of 141%, indicating higher earnings generated per share. Overall, Bank Alfalah's financial performance highlights significant growth, improved profitability and effective management during the quarter. Bank’s market share increased for its several products and it continued to make significant investments in people and technology while exercising strict credit discipline.

The net profit margin for FY22, FY21 and FY20 stood at 8.51%, 14.19% and 11.31%, respectively. The net profit margin represents the percentage of revenue that translates into net profit. The declining trend from FY21 to FY22 indicates a decrease in profitability, potentially due to various factors such as increased expenses or lower revenue.
The bank’s earnings per share (EPS) growth rate for FY22, FY21 and FY20 was 28.37%, 35.82% and -17.64%, respectively. The positive EPS growth in FY22 and FY21 signifies an increase in earnings per share, indicating improved profitability. However, the negative EPS growth in FY20 suggests a decline in EPS, indicating reduced profitability during that period.
The price/earnings to growth (PEG) ratio for FY22, FY21 and FY20 was 0.12, 0.12 and -0.44, respectively. The PEG ratio evaluates the relationship between a company's price-to-earnings (P/E) ratio and its EPS growth rate. A PEG ratio below 1 is generally considered favourable, as it indicates that the stock may be undervalued relative to its growth potential. In this case, the PEG ratio suggests a positive outlook, with the bank's earnings growth aligning with its valuation.
Credit : Independent News Pakistan-WealthPk


